The Bank for International Settlements (BIS) publishes statistics about the global financial system. The data is compiled in cooperation with central banks and other national authorities and provide information about financial stability. More information can be found on the BIS statistics website. Data exploration can be done either through the BIS Statistics Explorer, BIS Statistics Warehouse or by downloading the raw CSV formatted files. The last option is very interesting from an automation perspective, as it allows you to use your analysis tool of choice.
The following statistics can be downloaded from here:
- Locational banking statistics
- Consolidated banking statistics
- Debt securities statistics
- Credit to the non-financial sector
- Debt service ratios for the private non-financial sector
- Property prices: selected series
- Property prices: long series
- Effective exchange rate indices
As I’m exercising from time to time a bit with F#, I decided to write a Type Provider which i) extracts out of the CSV file the definition of the data ii) generates an abstraction layer which simplifies filtering on the file. The main advantages are:
- Developer/research analyst analysis data through abstraction layer. No knowledge of CSV file parsing required.
- The IDE provides syntax highlighting based on the definition extracted out of the CSV file. (The consumer does not need to know the dimension and codes by heart).
- Compile time errors in case dimensions or codes which do not exist in the definition were used.
- Simple but powerful way of filtering the data (observations).
- One generic F# Type Provider for all above mentioned statistics.
The source code of the provider is available on GitHub and it’s currently in alpha state. There are some know issues but they don’t prevent you from browsing the “Property Prices”, “Locational Banking Statistics” and “Consolidated Banking Statistics” data as of the date of writing this blog post.
The following examples show how to utilize the BIS Type Provider.
Property Prices
I’ve downloaded the Property prices: long series CSV file as the structure of this data is very simple and perfect for this demo. Firstly (see code block below), the “PropertyPrice” type must be defined. By doing this, the BIS Type Provider analysis the CSV file and generates the PropertyPrice.ObservationFilter plus one type per dimension of the property price data. In this case the types “Frequency” and “Reference Area” were generated and each of them contains generated fields per dimension member.
As shown in the picture below, the definition of the data has been reflected in the code. With this, we have full IntelliSense support and compile-time checks!
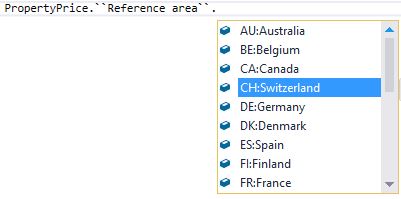
Property Price – Reference Data dimension
It requires only 3-4 lines of code to filter out a certain observation out of the data. The last part of the code builds up a line chart for the data we were looking for. I’m using the FSharp.Charting for the visualization.
open System
open System.Linq
open System.Collections.Generic

open Bis
open FSharp.Charting

type PropertyPrice = Dataset<"C:/full_BIS_LONG_PP_csv.csv">

[<EntryPoint>]
let main argv =

    // Create filter
    let filter = new PropertyPrice.ObservationFilter()

    // Define criteria
    filter.``Reference area`` <- [ PropertyPrice.``Reference area``.``CH:Switzerland`` ]

    // Apply filter and plot
    filter.Get()
        |> Seq.map (fun o ->
                        o.values
                            |> Map.filter (fun k v -> v.IsSome)
                            |> Map.map (fun k v -> v.Value)
                            |> Map.toSeq
                            |> (fun x -> Chart.Line(x, Name = o.key)))
        |> Chart.Combine
        |> Chart.WithLegend(true, Title="Switzerland property prices")
        |> Chart.Show
And this is the output of this code.
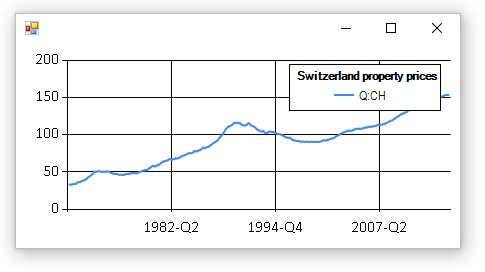
Property Prices – Switzerland
Consolidated Banking Statistics (CBS)
Let’s go one step further and analyse data of a much more complex dataset. The CBS file contains much more records and dimensions than the property prices. The following piece of code looks up a certain observation between Switzerland and Bahamas + Singapore and plots the outcome in a chart. Same as for the previous example, the CSV file was analysed by the BIS Type Provider and relevant types were generated. And again, we have full IntelliSense support as the properties on the “filter” and also the members under “Cbs” exist in code.
open System
open System.Linq
open System.Collections.Generic
open Bis

open FSharp.Charting

type Cbs = Dataset<"C:/full_BIS_CBS_csv.csv">

[<EntryPoint>]
let main argv =

    let filter = new Cbs.ObservationFilter()

    filter.Measure                               <- [ Cbs.Measure.``S:Amounts outstanding / Stocks`` ]
    filter.``Reporting country``                 <- [ Cbs.``Reporting country``.``CH:Switzerland`` ]
    filter.``CBS bank type``                     <- [ Cbs.``CBS bank type``.``4R:Domestic banks(4B), excl. domestic positions`` ]
    filter.``CBS reporting basis``               <- [ Cbs.``CBS reporting basis``.``F:Immediate counterparty basis`` ]
    filter.``Balance sheet position``            <- [ Cbs.``Balance sheet position``.``I:International claims`` ]
    filter.``Type of instruments``               <- [ Cbs.``Type of instruments``.``A:All instruments`` ]
    filter.``Remaining maturity``                <- [ Cbs.``Remaining maturity``.``A:All maturities`` ]
    filter.``Currency type of booking location`` <- [ Cbs.``Currency type of booking location``.``TO1:All currencies``]
    filter.``Counterparty sector``               <- [ Cbs.``Counterparty sector``.``A:All sectors`` ]
    filter.``Counterparty country``              <- [ Cbs.``Counterparty country``.``BS:Bahamas``; Cbs.``Counterparty country``.``SG:Singapore`` ]

    filter.Get()
        |> Seq.map (fun o ->
                        o.values
                            |> Map.filter (fun k v -> v.IsSome)
                            |> Map.map (fun k v -> v.Value)
                            |> Map.toSeq
                            |> (fun x -> Chart.Line(x, Name = o.key)))
        |> Chart.Combine
        |> Chart.WithLegend(true, Title="Switzerland vis-à-vis Bahamas and Singapore")
        |> Chart.Show
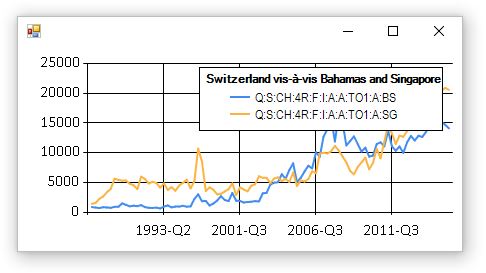
CBS – Switzerland vis-a-vis Bahamas/Singapore
The cbs.Filter() function returns a list of observations and their values for all periods. With F# you can easily slice out and aggregate data. In this code snippet we use the same filter as above and sum the values of 2015-Q1 across Bahamas and Singapore.
let sum =
    filter.Get()
        |> Seq.map (fun o ->
                        o.values
                        |> Map.filter (fun k v -> k = "2015-Q1" && v.IsSome)
                        |> Map.map (fun k v -> v.Value)
                        |> Map.toSeq
                        |> Seq.sumBy (fun (k,v) -> v))
    |> Seq.sum
I hope you like the BIS Type Provider. 🙂 Contributions are welcome!